Thursday 11 December 2014

What's wrong with a Little predictability?

I was asked recently about Little's law. For the uninitiated, it is a fundamental, but elegant result in queuing theory. It's akin to the simplicity of Einstein's 'E' equals mc squared as it reduces a whole heap of complexity into a few simple variables. It is now finally being applied to software Kanban having existed way before the field of software engineering ever existed.

In software, it's pretty simple and relates the average number of cards in play (between the backlog and done) to the average cycle time and arrival rate. If your arrival rate is the same as your service rate, which in Scrum you would expect it to be if you're delivering all your cards in that Sprint's time period, you end up with a pretty good link.

So what's the problem?


The issue is (again) that people miss a crucial detail. It's how KISS differs from Occam's razor and how folk abuse the agile manifesto. Remember the items on the right? Now do you remember the last statement that references them? ("Whilst there is value in the items on the right, we value the items on the left more").

With Little's law, it is that the team has to attain predictability. That predictability is the team consistently delivering the same number of points every sprint and/or having a consistent cycle time. Little's law doesn't technically have a stochastic component, so obviously needs stability to attain a zero variance. The problem you have, especially at the beginning of each 'project' [*grumble* *humbug* need #NoProjects] is that you do not have that stability. Teams can under or over-perform, so there isn't stability. That said, a team that is also improving and delivering 'more', which is always desirable, then has the disadvantage that they're not naturally stable! They are delivering more, so naturally the average changes.

But isn't improving a good thing?

Totally! It's the best thing you can do! However, if you are hoping to use Little's law to project/forecast in an environment which is improving, you can't do it because of this. At least, you can't do it without the introduction of a stochastic component, or comparing against the desired burn-up. Believe it or not, improving is instability which naturally increases the variance of the delivery as a whole. That's your trade off! Continual improvement means you cannot gain the stability needed to use Little's law!

*shock horror*

Are you sure?

Yep, very!

Consider the following graph. it shows a team's data where they do not improve their delivery and are running late to start. If projecting forwards, their variance is very narrow. You're going to be very late, but you're pretty sure they are going to be late. If you plot the projection of the end of the 'project' through the average burn-up as you accumulate ACTUAL data, you'll see where it's likely to be:


Team who do not improve


Little's Law could be used here to project where they're going to be and if you look at the range of possible outcomes in the time allotted or the time variance needed to complete the scope (remembering the golden triangle) you'll see this is much narrower than the team who improve below!

Team practising continuous improvement
Here Little's Law is pretty much no use! Indeed, in most teams, you can't get enough of a data set for each improvement to measure the average and deviation reliably.

Conclusion: What to do?

At the end of the day, you're just trying to give yourself the best chance. It’s not intuitive to applaud greater variance, since that’s normally greater risk, but because the variance needs to ‘cross’ a value (the average, which in this case is the original burn-up. i.e. 'fixed' at the outset if scope is fixed), it’s the more points you deliver ‘above the thick red line’ that count. If it swings wildly with the majority of the mass below the red line, you’re scr3wed. If it’s above, you're rocking! This is why I prefer to get the average of teams to be on or above the red line and then reduce the variance, since this gives you greater certainty about the burn-up rate.

So, in short, there are a million and one tools out there to help folk with software development and predictability. Teams have to be careful they don't pick a tool and misapply it and it's these limits that often tell us whether it is appropriate or not to use it. The situation where it doesn't work may outnumber the ones that do. We're not all hammering nails, after all.

Friday 21 November 2014

#LeanConf 2014: 4 Fave Presenters

Short one this one, as it has been an exhausting week!

I was at #LeanConf in Manchester this week and of the amazing and inspiring speakers, there were a few that stood out. My top 4 were:

Ton Wesseling 

twitter handle: @tonw

Hands down my personal favourite presenter there! Being a bit of a data geek myself, I loved the data and educational elements of his presentation. Whilst not new to me, he's the sort of guy in the industry who can help organisations close the leaning loop by allowing you to truly understand your data, improvements, A/B-test results, what to focus on and what to ignore. When you are the only guy in pretty much every single company you go into who walks and talk agile metrics, performance, statistics, learning, data, data and more data, it can get to be a very lonely place until you find another person in the world who shares the same passion, knows what's just enough, and both its importance and pitfalls.

I took the time to speak to Ton after his presentation, specifically about how to get the statistical thinking into some teams as this often requires bridging a huge skills gap ad his answer was pretty simple. Employ psychologists! I have long thought that psychologists have a place in organisations, but I as yet to be convinced that I could justify suggesting a formal psychologist role at team level so steered clear of suggesting them. Psychologists bring both human psychodynamics AND statistics to the table, since they have to study it. So having this suggestion come from someone who's done it does add some validity to the idea, so I look forward to trying it out.

Janice Fraser 

twitter handle: @clevergirl

My favourite presentation from an entertainment point of view. It was awesome to see her present and she had me and the rest of the audience in fits of laughter! My stomach was aching the whole day after as if I'd had a session at the gym... and I do go to the gym! Her presentation about Gab Zichermann's new educational system and use of games and puzzles to educate helped promote curiosity and traditional skills in education. I have to vouch for this, as whilst I was classically educated, it was the stuff I did outside school that put it into practise and hence, allowed me to score highly in school/college/uni yet not have to do a single day's worth of revision, because these were skills I used all the time. Definitely think there is something in this.

Tristan Kromer 

twitter handle: @TriKro

My best memory award goes to Tristan. His slides didn't work unfortunately, but he blasted through the whole presentation, by heart, without missing a step. Awesome professionalism!

This isn't to say that other presenters weren't good, as it was a tough choice. Everyone will have a different favourite 3. For example, Barry O'Reilly from ThoughtWorks provided an informative talk on a classical Enterprise Agile problem, optical illusions and plenty of Watermelons :)

Ash Maurya

twitter handle: @ashmaurya

The author of Running Lean spoke about how companies are basically customer factories. Thy produce happy customers. He also talked about testing the market and the crucial feedback loop that allows the factory to respond to market opinion and change. He's certainly well aware of the need to consider the data when deciding how much to invest and work with.

Enjoyed #LeanConf! Especially since I won a copy of Ash Maurya's book, Running Lean for asking a question at the right time. Looking forward to next year! :)

Wednesday 29 October 2014

Cone Head!!

A topic that seems to come up time and time again that folk seem to either take to or not, is the idea of an 'uncertainty cone'. I briefly touched on this in a previous post where I was violently disagreeing with Woody Zuil and Nick Killick, not on their principle of #NoEstimates, since the method has definite merit, but on the specifics of the merit that it has.

I'll take this time to explain a little more about the cone of uncertainty for those who are not familiar with it, or who would like to see a more practical example of what it is. To do so, let's consider 10 flips of a coin as the example. There are 2 to the power of 10 possible combinations of 10 head or tale results.

Before rolling the die a first time, I want you to guess what the final total may be. How many heads do you think you'll get?

Well, if you think about all the combination (0 heads, 1 head, 2 head...) and thus build a histogram of all results, you get this:

number of heads when flipping a coin 10 times - University of North Carolina (via Google images)
I'll come back to this later, but you should have a number in your head. Let's now consider the range of all possible numbers of heads at the end from this point. i.e. before the first flip. You can either get a minimum of 0 heads, or a maximum of 10 heads, or of course, anything in between right? Cool.

1st Flip

When you flip the coin the first time, it comes up say, tails. This does two crucial things:


  1. It gives you an actual result to work with, so you now have 9 uncertain results and 1 actual result.
  2. Now that you have flipped a tail, you cannot get 10 heads. Given that in the above histogram which applies all the time, there is only one scenario, that scenario is now out! The best you can hope for is 9 heads, given you've flipped 1 tail.
Drawing up the table of min and max heads after the first flip we can see:

2nd Flip

Flipping the coin the second time, it comes up say, heads. This also does two crucial things:


  1. It gives you an actual result to work with, so you now have 8 uncertain results and 2 actual results.
  2. Now that you have flipped a head, you cannot get 0 heads, because you have at least 1. Given that in the above histogram which applies all the time, there is only one scenario with 0 heads, that scenario is now out! Your rage is now 1 head to 9 heads.


Put this in the table and flip again. Follow the rule that if you flip a head, you increment the minimum by one, otherwise you have flipped a tail so decrement the maximum heads by one (because you now don't have enough flips to get the previous maximum).

<<Fast Forward>>

10-Flips


10-flips completed

So we've completed the whole 10 flips, incrementing the minimum if we get a head and decrementing the maximum if we get a tail. Surprise surprise, by the end, we have two ends that meet in the middle (which is correct, because by that point, we have 10 actual results and thus, no uncertainty at all). You can double check this by counting the number of heads you got, which is 4 in this case, against the meeting point of the maximum and minimum, which is 4. If you don't, then you've banjaxed your counting, so you might want to ask a 3 or 4 year old for help next time.

Making the Cone

From this table, we simply have to plot the flip number against the minimum and maximum number of heads. So let's do that. I've also included the trend lines, in black, which show the trajectory of the minimum and maximum numbers. The gap in the middle is the level of uncertainty or variance:


cone of uncertainty

Let's recap what happened. At the beginning, we had no idea where we were going to end up [with how many heads], aside from the range of 0 to 10 heads. As we progressed, we reduced the size of the range of possible 'options' or heads we could get and by the end, we were where we were.

Map this to typical IT projects. At the beginning, we have no idea where we're going to finish. As we progress and choices are made (which honestly do sometimes seem random), we reduce the total number of potential options that we have (which isn't always a bad thing, especially if we discount the highest waste or risk options) and eventually, we come to rest somewhere. Also, despite everything, we always know where we're are starting. We're starting 'here'. The end of the last cone (or part thereof).

And the First Histogram?

Returning to the histogram, which is built up from a knowledge of all possible combination of coin flip (it is a closed probability space mind you, which isn't always the case in software), you can see straight from this that the best options for your guess is 5 closely followed by 4 and 6 heads. The curve is a bell curve, aka Normal Distribution, and in this case it is fine.

Epilogue

The only real difference with development is the probabilities in software development are somewhat conditional, since the decisions we make are not random, but somewhat stochastic, or at least Bayesian, since we ourselves learn and make better decisions or become more productive, which help us descend the cone faster. It's good enough, so should still be used, but if you're a masochist, then I best at least tell you that something has recently come to my attention in the field of theoretical statistics which may be useful for the part that is currently quantified normally. That something is the Tracy-Widom distributions, which appear ever to slightly skewed to the right. It's not something I've used [yet] and it is somewhat advanced, but I am excited to see where this field goes.

Sunday 12 October 2014

Evolving & Emerging Architecture: Agile-EA

Going into companies is always an interesting experience. You get to view the way they work and in agile organisations using physical boards, you can walk the floor and view how the work is progressing. That is well known in the agile project management arena, product owner roles etc. but it's also an extremely useful technique in the Agile Enterprise Architecture world (Agile-EA). Before going into why, we need to recap a couple of definitions.

1. Conway's Law

In 1968, Melvin Conway provided this now tried and tested gem.

"organizations which design systems ... are constrained to produce designs which are copies of the communication structures of these organizations"

This is a huge revelation for some companies, but it got hidden by process oriented techniques, which masked the problem for decades.  

In the agile space, it's a very different story. The reliance on teams to develop their own processes, and having the greatest expressive power within them as opposed to across them has resulted in this being more applicable than ever. You can turn this to your advantage and having elements of a workflow which make up the greatest proportion of it, contained within teams really improves the rate of delivery of work, as I have covered in previous posts and is a much better facilitator of outcome than having a distributed development team. This also means that cross-team communication encourages the development of a system through that communication channel.

2. Consumer Driven Contracts

A consumer driven contract can be considered a Kanban pull signal. This pulls a feature from another team and in software development spaces, this also includes a sub-suite of tests from the consuming team. When a feature provided by another team is needed, a cross-team card, often of a different colour is placed on the team board who are to provide that functionality (at Laterooms,com for example, they used rainbow coloured cards at one point). That team then pick the card up and code against the tests to make them pass. 

Consumer driven contracts are pretty much the most central concept in true just in time, cross team software delivery. They often have a subtask link to the source board and effectively provide an architectural link between application components or business features.

This provides opportunities for architects in both the enterprise and/or solution sphere to see how their estate is evolving by simply going to all stand-up meetings, and building a picture of the emerging architecture or estate by following the chain of tickets. Once such a ticket appears, this introduces an architectural dependency and over time, more and more tickets appears which fill the space between things that architecture lives in.

Walking the Floor

Architects live between things. As architects we should aim to get to every stand-up within our sphere. When we do, we should look out for these cross team tickets, or features being played which we are aware touch something else or perhaps could leverage a feature elsewhere in our estate. 

Imagine we go to the stand-ups and see the following boards after, iteration/sprint 10. 


Sprint 10 board states


Sprint 11 sees a purpose ticket appear on team board 1, required by team board 2 (who are pulling it). The purple ticket represents a cross-team 'pull' (indicated in team 2's 'X' ticket for convenience) since it requires a feature from team 2. The dotted line now represents the relationship between the two teams, which remember by Conway's law represents a link between the system or business features:

Sprint 11 emerges an architectural link

This continues to be played and supposing by the end of Sprint 11 it and its compatriot pull are both done. This ticket is now complete and the architectural link has been delivered. So the architecture of the estate now looks like the following (Arrowed lines represent a dependency):

Sprint 11 Architecture - Note, no Team 4 features live, so architect doesn't care

Sprint 12 and two purple tickets appear. One from team 3 to 1 and one 4 to 2. The solid line represents the delivered link from Sprint 11:

Sprint 12 Architecture
When this is delivered, the architecture then looks like:

Architecture after Sprint 12
And so the cycle continues. 

Conclusion

Each one of the dotted lines represents a communication flow between two teams and brings them closer for that phase of the development. When it's done, the link still exists in the system (solid line), but they can separate and form relationships with other teams, as team 1 did with team 3, after team 1 finished with team 2. Of course, there are times when the platform will need to delete those links, removing them from the estate, but the communication still happens regardless. 

As an architect, attending the stand-ups is a great way to see how the system evolves. You can walk the boards looking for these special cards and draw out the architecture as you proceed. Indeed, if you're an active contributor (and you should be) you can and should facilitate the teams to make decisions which are systemically optimal and forming links when the team could otherwise expend a lot of effort would save them and the company time and money. As the organisation matures and the role of software architect embeds in the teams (as roles over job descriptions), it is these individuals who will go to other team stand-ups and hence, facilitate the creation, updating or destruction of these architectural links.

Wednesday 10 September 2014

Going from Acceptance Tests to Code

When working with a dev hat on, I keep getting overruled in discussions by programmers who either don't seem to get what I am saying or don't seem to want to get what I am saying. One theme that comes up time and time again is the issue of acceptance testing and how to test. There is often the view that it is the QA's/BA's jobs to specify the acceptance test and that unit testing is the preserve of the developer, who only gets them when the QA's have finished, or just as bad, develops their code in parallel.

Now, this obviously creates the very silos that agilists always claim were 'bad' in traditional methods. I am not a great believer in 'owning' code and also believe that a generalist skill-set is better than a specialist one, as otherwise you get blockers when people are off on annual leave or sick, or you get massive contention on the times of these people. So this is yet another thing that narks me.

Hence, in the spirit of breaking these barriers, I am going to spend this blog post writing code.
In order to do that, we need a story card. So, let's have the following:

"As a tutor, I want to be able to recall the marks of my top 3 students at the end of the year to be able put them forward for end-of-year awards."

Simple enough. So using SpecFlow, MSTest, C# and SQL Server Express Edition, how do I turn this into code?

There are many ways to make this happen, including starting with a walking skeleton and pushing the acceptance criteria down through the layers until it exists in the database or by elaborating on the criteria enough to develop the example using design by contract.

Acceptance Criteria 

There are many ways to make this happen, but working with the tutor and using agile methods, we pick this ticket up, elaborate on it with the tutor and we can come up with something fairly reasonable using Gherkin syntax which represents this.

My personal favourite is using specification by example. This allows the dev, QA and BA to engage the product owner/customer in a role play session, defining at each stage an example, say, message passing, website form, document, customer service agent etc. that can tease out example scenarios with example data for each feature developers are being asked to deliver.

For example, the end result of this after interacting with this tutor may be:


Feature: TopFlight Students
 As a teacher, 
 In order to find the top 3 performing students,
 I need to retrieve the average student marks for the year 
 And pick the top 3

Scenario: Pick the top 3 performing students by average score
Given I have the following student marks:
 | ID | Surname | Forename | Score |
 | 1  | Joe     | Bloggs   | 55    |
 | 1  | Joe     | Bloggs   | 73    |
 | 2  | Freb    | Barnes   | 61    |
 | 3  | Jane    | Jonas    | 83    |
 | 4  | James   | Jonas    | 85    |
When I press retrieve
Then the result should be as follows:
 | ID | Surname | Forename | AverageScore |
 | 4  | James   | Jonas    | 85           |
 | 3  | Jane    | Jonas    | 83           |
 | 1  | Joe     | Bloggs   | 64           |


Having established the acceptance criteria here, we can develop the steps and use stub objects to return the expected values, which become something like the following skeletal SpecFlow steps file which tests the TopFlightEngine static class:


using System;
using System.Collections.Generic;
using TechTalk.SpecFlow;
using TutorMarks.TopFlight;
using Microsoft.VisualStudio.TestTools.UnitTesting;
 
namespace TutorMarks.TopFlight.Test.Feature
{
    [Binding]
    public class TopFlightStudents
    {
        // Added the student scores
        private IList<StudentRecord> studentRecords;
 
        [Given(@"I have the following student marks:")]
        public void GivenIHaveTheFollowingStudentMarks(
                IList<StudentRecord> studentScores
            )
        {
            studentRecords = studentScores;
        }
 
        [When(@"I press retrieve")]
        public void WhenIPressRetrieve()
        {
            // Press retrieve
        }
 
        [Then(@"the result should be as follows:")]
        public void ThenTheResultShouldBeAsFollows(
                IList<StudentRecord> expectedTopFlightScores
            )
        {
            IList<StudentRecord> actualResults = TopFlightEngine.RetrieveTopFlightStudents( 
                    studentRecords 
                );
 
            Assert.AreEqual( expectedTopFlightScores.Count, 3, 
                @"The expected number of results were not returned." );
 
            forint index = 0; index < actualResults.Count; index++ )
            {
                AssertPropertyEquality("ID", index, 
                    expectedTopFlightScores[ index ].Id, 
                    actualResults[ index ].Id);
 
                AssertPropertyEquality("Surname", index, 
                    expectedTopFlightScores[ index ].Surname, 
                    actualResults[ index ].Surname);
 
                AssertPropertyEquality("Forename", index, 
                    expectedTopFlightScores[ index ].Forename, 
                    actualResults[ index ].Forename);
 
                AssertPropertyEquality("Score", index, 
                    expectedTopFlightScores[ index ].Score, 
                    actualResults[ index ].Score);
            }
        }
 
        private static void AssertPropertyEquality(
            string fieldName, 
            int index, 
            object expectedElement, 
            object actualElement)
        {
            string CONST_DIFFERENT_RESULTS = 
                @"The property {0} for record {1} is unexpected. Expected {2}, Actual {3}";
 
            Assert.AreEqual(
                expectedElement,
                actualElement,
                String.Format(
                    CONST_DIFFERENT_RESULTS, new object[]
                            {
                                fieldName,
                                index,
                                expectedElement, 
                                actualElement
                            }
                    )
                );
        }
 
        [StepArgumentTransformation]
        private IList<StudentRecord> MapTableToStudentRecords(
                Table source
            )
        {
            List<StudentRecord> result = new List<StudentRecord>();
 
            foreach (TableRow row in source.Rows)
            {
                result.Add(new StudentRecord()
                {
                    Id = int.Parse(row["ID"]),
                    Surname = row["Surname"],
                    Forename = row["Forename"],
                    Score = float.Parse(row["Score"])
                });
            }
 
            return result;
        }
    }
}


Now, remember, for the sake of the illustration and learning why arbitrary test criteria in TDD is a bad thing, look at the bigger picture.

After eventually making the tests go green, the following can be seen (I should have been a poet):

namespace TutorMarks.TopFlight
{
    public class TopFlightEngine
    {
        public static IList<StudentRecord> RetrieveTopFlightStudents(IList<StudentRecord> studentRecords)
        {
            return new List<StudentRecord>
            {
                new StudentRecord() { Id = 4, Surname = "James", Forename = "Jonas", Score = 85 },
                new StudentRecord() { Id = 3, Surname = "Jane", Forename = "Jonas", Score = 83 },
                new StudentRecord() { Id = 1, Surname = "Joe", Forename = "Bloggs", Score = 64 }
            };
        }
    }
    // ... Located in another file
    public class StudentRecord
    {
        public int Id { getset; }
 
        public string Surname { getset; }
 
        public string Forename { getset; }
 
        public float Score { getset; }
    }
}


What pertinent things do you notice? Correct! It only returns the EXACT averages as the tutor expect to see them. This is your 'dumb' wireframe/pretotype. One thing it is NOT is a walking skeleton, as that implies a piece of functionality that manifests through all the connected components of an architecture as a tiny implementation (basically, not actually having any substance to it. Akin to testing with arbitrary data and making sure "...the web bone's connected to the service bone. The service bone's connected to the data bone...", jehee... see what I did there?). This precedes even that! It allows you to get feedback quickly to yourself and builds from the acceptance criteria to the code from the very beginning of a project.

This SAME  pretotype can then be elaborated even further with the tutor by adding more example scenarios. For example, it can be established that the 'mean average' (as opposed to modal or median) is the calculation that brings about the expected results.

For each part of the whole (let us call this part a 'unit'), when playing out the scenario with the customer, using these examples, their view would be as follows:
  1. Take the scores for each student (e.g. "Joe Bloggs"), who is identified by a single ID (the number 1)
  2. Add their scores up (55 + 73 = 128), keeping track of the number of scores they have (2 scores)
  3. Divide the total Sum of the scores by the number of scores they have ( 128 / 2 = 64 )
  4. This is your average score (so average score = 64 )
So, can you see what we have here? Correct! You have a series of test scenarios that you can use to substantiate the pretotype, which relate to the ORIGINAL acceptance criteria! As a result, everyone can see how the unit level code delivers the acceptance criteria all the way through the process.

Taking each step in turn and noting that we can then deliver the individual steps by developing units which use the examples in the steps as acceptance criteria. We then go on to deliver a unit testing class which tests for the correct number of results and then the average results etc. etc,

Benefits, Warnings, Tips

One thing that has consistently been a problem in the past is how to align acceptance and unit tests. If you don't have full code coverage at acceptance tests level, you run the risk of allowing development too much leeway in creating examples which are not aligned in other components of your architecture. That said, given acceptance tests tend to be slow in nature, you could trade off some acceptance specifics, that are low value or risk, such as exception cases, for unit test coverage in that domain, since the 'unit' is typically where such exceptions originate.

Developing unit tests back from the acceptance tests with examples usually give you the highest value cases and secondary scenarios, which automatically gives you unit test alignment with the value that the stakeholder wants. Build on those to then fill out the unit with exception tests, say, potentially mocking them out if you need to.


Tip 1: Take care that that acceptance tests and unit tests are 'joined up'.
This should automatically happen, but there are many a case where it doesn't. This is why working back from the acceptance criteria examples is best to do. If the examples are courses grained than you need at the unit level, discuss it with the stakeholder.


Tip 2: Know Your Context and Watch your coverage!
This is a contentious one. I am of the view that things should be covered 100% in some form. Acceptance tests really help cover at least 80% of the value. However, there are often edge cases and bugs which come about which resulted from unforeseen scenarios. Adding a test for the bug is great, as this fills the gaps, but be aware that it's possible to have acceptance tests cover 80% say, unit tests to cover 100% of the code, but you still have integration problems which result from the 'missing' 20% acceptance tests or bugs resulting from data you/the stakeholder hadn't thought of. This is why integration tests came about, but if you have 100% acceptance test coverage, you don't need integration tests at all, because that's already in the acceptance tests anyway.

This won't always be possible. For example, interfacing with some cloud providers. So know the context of the system and work with that to deliver right up to the cloud service boundary.

Also, don't forget that overusing mocks is a bad thing and unit testing just the edges around the value covered by acceptance tests (if they're not 100%) doesn't prove anything credible either, since you can't isolate an error in acceptance tests by the unit tests that way. I've illustrated the problem areas below, since they will need special attention. Perhaps another discussion with the business owner. Note, green includes unit test coverage and has been removed for clarity.

With mocks. Acceptance test in green, unit test coverage. Red indicates potential areas for bugs, so pay special attention to them.


Without mocks (or only at the extremeties) Again pay particular attention to the red areas.

One of the difficulties is that the red areas are points where the developers don't necessarily have enough information to go on. i.e. they can't set up their tests without potentially fabricating some tests data and the overall behaviour of the system may or may not be consistent with the information used in the other red area(s). Hence, your test suite has the potential to use different entities, with partial overlaps in fields, to get different results in these two different areas of the system.

So make sure that a combination of examples you use makes sense. This might necessitate checking what's in the tests already to make sure you don't create an absurd scenario, such as using random credit card digits for a number in a section of the site you're not interested in unit tests, only for someone else to develop a Luhn validation algorithm and it breaks in all these cases. Not nice to leave cleaning up that sort of mess to your colleagues!

Thursday 28 August 2014

Drawback of Shared Service: Part 2, Improving on Shared Services

A month or so ago I wrote about some of the biggest drawbacks of shared services in today's market. There are folk out there who make their living delivering these shared services, so I was approached and asked why I felt such a need to denigrate them. That wasn't really the point of the blog and perhaps I could have phrased the somewhat 'tabloid' headline better, especially when I cited them as Evil (which in an accelerated delivery sense, they are but are so nice to reason with, even in purely SOA circles). However, it also became clear that mapping the flow of work through  business hasn't really been done by some in that camp before and hence they didn't have visibility of the actual flow of work through the system.

Kanban and visual management really helps make explicit the work that is goign on. Plus, shared services are only evil in agile and optimised worlds, where the fitness of a company is ingrained in a company's need to adapt and deliver at a fast pace. They form bottlenecks and hence constraints in traditional systems, even if they themselves deliver things quickly (i.e. they are suboptimal). The focus of the last blog was on these systemic issues, not on the individual services and I assumed that the shared services were in themselves optimised. Don't forget, constraints are a natural and expected concept in Systems Thinking and indeed, form a critical concept in the Theory of Constrains. When systemic problems they bring are solved, they are something I and anyone else working in business optimisation positions should be aware of and then look around to see where the constraint has moved to, because they will.

Revisiting Shared Services

Shared services are a stand alone service in a company. They may or may not have budgetary and reporting functions, may have all the elements to deliver a service end-to-end in their arena or perhaps most optimally, deliver business features to other services. They are often characterised as having one accounting cost centre, even if they cut across multiple skill-sets.

For example, in one company, an IT shared service may not have budgetary and HR control consist of:

  • Distinct Tech Support teams - With management
  • Testing teams - With management
  • Software Development teams - With management
  • System Operations/Technical/Network services teams - With management
  • Overall departmental/service management


In another company, their IT service may consist of:
  • Distinct Tech Support teams - With management
  • Software Development teams consisting of DevOps, BAs, QAs/testers - With team leads
  • System Operations/Technical/Network services teams - With management
And management of each team has budgetary responsibility etc.

And indeed, it could be fairly mature and have teams that delivers end-to-end ad support the application.

Getting teams to be more effective inside the bounds of a shared service is a noble goal, but the problem is the constraint then shifts to being a systemic problem, which is what I illustrated last time.

Is Optimising Shared Services Useless?

Not really. If you are moving from a traditionally hierarchical organisation to a flatter, leaner more agile one, it can be a very useful first step and indeed, almost always is. Just getting everyone in the same team who is responsible for delivery in that shared service ad visualising the work they are each contended for is an incredibly useful way to see how they are being pulled from pillar to post. 

However, further down the line, this ceases to yield any significant improvements in value delivery, simply because of the contention on the service as a whole.

If I had to provide my top-4 tips on how to transition from traditional shared services to lean, multifunctional teams, they would have to be:

1. Pick a Stakeholder's Departmental Concern 

Start with the needs of a stakeholder and map the flow of their end-to-end tasks through the entire organisation, noting the departments and functions it touches. 

This often manifests as perhaps a customer entity which starts as a form on a web page, then becomes a record in the DB, then becomes a task for an engineer to come out and do and a conversation that a customer has with a call centre representative when they register an account once the work is completed etc.

To illustrate this through a well known medium, in IT, this can often manifest as the ALM process, for example:

Mapping a sample software ALM to departmental functions

Once you have that list of departments for each individual journey, get everyone in that journey into one team. That way they are all aligned to that one value chain. Note the responsibilit numbers above and the team members below:

Collating members of the value chain into one team

2. Map & Optimise Implicit factors & Visualise EVERYTHING!

These are often 'invisible' supporting functions, such as internal technical support, network services, software licensing, recruitment of team members, capital expenditure for servers etc. These have an impact on the performance of the team, especially in delivery. 

Perhaps the most famous of these is the move to DevOps from SysOps, especially when capital expenditure for servers has traditionally taken a long period of time. First the server is specified, then it is requested by tech services, finance have to approve it, tech services have to build it, SysOps have to provision it on the network, then the system is deployed on to it before going live. Each of those context switches (which is effectively what it is for the server being switched) takes a significant period of time. 

Changing Capex to OpEx (e.g. by using PAYG Cloud Services) especially those coming in under delegated departmental financial authority (especially with the team accountant now being on board) then removes the need for the finance context switch and authorisation to occur, reducing the amount of items in the finance 'to do' list at the same time. This then means that SysOps/Tech services can provision services without the need to get finance authorisation, which is a significant enough saving, as it in turn reduces the lead time but also, if the SysOps staff members are then brought into the development team, this means the development team can then take the technical parts of some feature from inception to live without having to go outside the team, reducing the number of blockers they can't solve.

This can also be applied to HR, facilities, engineering etc. as long as the value chain make sense and the majority of their individual contribution is to this value chain and not some other.

3. The Value Chain is your alignment!

Overlay the journey in tip 1 onto your value chain. Make sure they match and identify and integrate where they don't. The actual journey is what you deliver, not the slide deck the value chain is present in, so that is your starting point and takes precedence. This gives you an aligned enterprise architecture baseline.

After that, look to transition to what your value chain 'vision' looks like on the slide deck, because I bet they don't match :) If you are lucky enough that they already do, or you've done the transition, make sure you're delivering the best value you can. That means revisiting the value metrics and seeing if there is a way to improve them. Chances are just aligning everyone will deliver improvements in itself, but there is always room for more :) 

For example, delivering faster improves financial metrics such as ROR, IRR and NPV which also improves ROI indirectly. Delivering predictably, reliably and with high quality reduces the need for contingency and some BAU processes. 

4. Munge Carefully, one change at a time!

When absorbing functions into teams, make the changes gradually. As usual, smaller changes are easier to integrate than larger ones ad this goes for people too. Smashing two tribes together only ever causes fights, so it is useful to be mindful of the psychology of folk. Indeed, in a lot of cases, most people take to the idea of being an team's authority really very well, even if they are reticent to leave the department they started in.

Conclusion

Creating Shared services which are fully self contained and are aligned to business value are the first step in what could be a long journey for some companies. It also has a very short shelf life, since they will get split and amalgamated into thinner verticals. As you can see fro the diagrammed example, we didn't map every single type of task each department had to do, just the ones that started a vertical and then overlaid the extraneous tasks over the top through implicit tasks which appeared as we looked at each journey.

There are many more tools and techniques which can be used to decipher the actual value chains, including some that can apply here. However, for brevity, hopefully this provides a reasonable start. Also, look into mapping the systemic flow of tasks, but do so for all tasks in the system. If you are looking for a reasonable primer on Systemic Flows, see Ian Carroll's blog for a really good start and primer in synergistic fluency.

Sunday 17 August 2014

Q: What Do Agility & Astrophysics Have In Common?

There is an agile coaching game called the static points game. It's an extremely useful illustration of how complexity evolves from really simple rules which in the enterprise world, shows how businesses always change under multiple forces, which should be familiar to those in the change management space. I've played it twice, the first was an introduction by Ash Moran whilst I was at Laterooms.com and more recently with Ian Carroll. It's pretty simply, to play:

  1. Get everyone to stand up and move to the edge of the room (or form a circle if the room is too big) 
  2. Tell each person to pick two other folk from the group 
  3. The simple rule is to stay equidistant (the same distance away) from both of them. 
  4. Then let them go.

What you'll see is the group organise and shift about, jostling as the distances come to an equilibrium, then eventually settle. You can play it again, telling people to keep the original two people,  and see where they settle this time. Chances are they settle differently from where they did previously (a digital camera might and high angle come in handy for this variation of the game :).

Reset the game, and with everyone keeping their two folk, fix any one person from the group where they are, perhaps using a chair and send everyone else back to the edge of the room and play it again. They settle quicker. Do it again with that one person fixed, and photograph. You can keep fixing more and more folk and the organisation comes to settle much quicker, with much less movement.


What does this Illustrate?

As an abstract systems game, it naturally covers a multitude of arena!
  • How departmental level business changes relative to other departments as politics plays a part in how departmental heads compete for work or pass blame. Imagine the people in that game are working in an organisation and trying to balance the needs of two sets of stakeholders.
  • How uncoordinated systems work with one another as they evolve (which I believe is what you think this refers to here). Imagine the people in that game are subsystems taking with interfaces to two other systems.
  •  How uncoordinated work-streams work with one another as they evolve (in agile environments, this is what I think happens with shared systems. They pull against the shared systems). Imagine the people in that game are subsystems communicating with interfaces to two other systems.
  • It shows how complexity can manifest from a really simple rule-set. This one is self-explanatory. Intelligent agents (i.e. people, bees etc.) using a really simple rule can still produce a significant amount of very complex behaviour. This, like all the rest, is called [mathematical] chaos.
  • It shows that relationships are easily equally as important as the entities themselves
  • How organisms relate to one another
  • It is a manifestation of planets being influenced by each other’s gravity
Mathematically speaking, they are ALL a manifestation of what is called the n-body problem. The planetary example that ends that list above is where this originated.

A Lesson in Planetary motion

We orbit the sun because our mass is significantly less than it. The effect we have on the sun is near negligible. This is like a big CEO of a company, keeping things in order by imposing forces upon the lower weighted levels, who can’t respond in any meaningful or significant way. However, the behaviour of the system is predictable and has been like that for billions of years. With the big, overarching, autocratic CEO (or C-Suite) in it, and with the absence of any other influential factors, the environment rarely changes, so there is no need for it to change. That is one sun and several planets and moons and their orbits (statics and dynamics) that systemically stay the same for millions if not billions of years, even if what goes on on the surface changes. As far as systems are concerned, architecturally, these are all static points. That’s a high level block diagram!

However, in agile environments, you are empowering folk, quite rightly. Hence, the gravity they have and are allowed to have, relative to the system, is much higher. However, returning to the n-body system, If you have two equally weighted planets orbiting around each other, they will pull each other’s orbits. If you have three orbiting each other, it has been proven that the behaviour of an unconstrained system, is near unpredictable aside from very restricted contexts (i.e. akin to how often waterfall delivered on time and on budget, which some would argue has the same probability that our solar system came into existence the way it has :) Plus, because the class of problem is the same for all of the above, this chaos or ‘randomness’ applies to all of the above examples too.

OK, how can you test if the result is random?

Firstly, this is a complexity problem. You can't necessarily test the system internals [aka business] as a whole if the result isn't predictable or consistent. However, what you can test, is that the unit which is the individual person, does manifest the rules correctly! i.e. they keep the same distance from their two folk at all points of change, including all points of jostling! After all, most software systems test that rules manifest correctly. For example, you can't open a bank account if you don't have ID or you can't board a plane for an international flight without a passport. Each and every one of the individual entities, as well as the whole in deterministic systems, is defined by: 

  • A pre-condition, which includes the initial state of the system - The position they are in in the room 
  • An action - Someone moves
  • A post-condition - They have to remain equidistant

With an invariant that they have picked two constant people to apply the rule with.

Which in BDD/Gherkin syntax is akin to:

Background each person has two different folk to focus on
##...

Given the person is in the room
When someone moves
Then the person has to be the same distance from their left-person and right-person

Remember, a static point is not just the structure or entity, it is also the behaviour it exhibits. Hence, the best way to make a change and make it testable, with the minimum of risk. is to nail all but one of the folk (read systems, which include the entities and how they behave – that is the aggregate of business, application, data and technology for each feature), make that small change, test they manifest the rules, then release everything, make sure the system didn't disintegrate (i.e. all the other elements correctly adhere to their own rules, which may be the old ones), then for the next change, nail all but a different one, make a change, release etc. The key is to test that the one body itself adheres to the simple rule you want of it! This provides parallels in systems?

For example, if in the static points game above, if we took just one person (which is a business unit or capability), let's call them 'delta' and made the rule that they stay an arms length away from everyone else and can pull the folk together if they are not, then played the game again. They may get jostled about a bit by the rest of the business going about its [old] business, which is still testable, whilst simultaneously pulling the two folk to their arms length distance. Note, through pulling folk, the rest of the system, that means folk who have picked one or other or even both of the people pulled by delta, and their 2nd, 3rd and nth degree of separation, will also change. So this new rule influences the system as a whole, but crucially, the rest of the system adhered to the old 'equidistance' rule, which like the new one, you can still measure individually (as mentioned at the top of this section). You measure that Delta is doing their job by ensuring they keep their two within 'punch distance' at all points of change, i.e. jostling.

Conclusion

Trust me, this is a very difficult concept for some folk to get and it requires some 'micro-thinking'. Indeed, it always provides a learning point in communication to me. Whilst there is almost nothing anybody in the IT world can tell me about non-linear system dynamics, there is a lot I have to learn about communicating the concept across in language people understand. That is why I attend community events, such as TechNights, Lean Agile Manchester etc. it’s to learn to effectively communicate the ideas to people who do not have that bridge or background. I've been through this sort of discussion a couple of dozen (or more) times and I still communicate this wrong now, because there may be levels of knowledge or skill between the person I am trying to communicate this to and the understanding of non-linear dynamics that would help illustrate the benefits of the knowledge. I'd be interested to see how others communicate this to analytical and non-analytical audiences alike.

So the best I can do for now is probably illustrate it with video. In the external links below, take a look and see if the systems look the same as each other after they've been running for a while. Indeed, you can run the YouTube vids side by side if your broadband is up to it.

External Links
n-Body Gravity Simulation like folk at the edge of a room - https://www.youtube.com/watch?v=XAlzniN6L94
n-Body simulation with 50 million entities - https://www.youtube.com/watch?v=OJaE9J39A8s

VIew these two 3 body problems side by side:
https://www.youtube.com/watch?v=VX9IdCnNWJI
http://vimeo.com/11993047 (from 24 seconds in - This also has multiple runs with different starting points)

Tuesday 8 July 2014

Kanban in IT: Why You're Probably DOING IT Wrong!

Despite it's age, especially in other fields, Kanban is a relatively new addition to the IT world. As someone who is easily just as inquisitive about the development process and working more effectively and systemically, when Kanban was mentioned all those years ago, I looked at the history of the process, put my mathematical hat on, my searching boots on and started to try to understand these systems in more detail.

For those who are not familiar with Kanban, it originated in the manufacturing world. Specifically, it stemmed from the study of supermarket demand in the 1940s which and later became the Toyota production system (TPS) in Taiichi Ohno's seminal work from 1988. Get that? Started in the 1940's! Some 60 years before IT ever got its hands on the idea.

The method became arguably the most solid foundation in Just-In-Time manufacturing bringing unparalleled and unmatched production quality and speed to the Japanese car market. As a child of the 80s, I remember the sheer envy of the rest of the world of the Japanese market, which at the time outshone the German market for efficiency. It even caused a plethora of Hollywood films about firms being subsumed (aiming to, or avoid) by Japanese companies, such was the dominance of the Japanese car market at that point.

Additionally, whatever you think of process improvement methods, Lean-Six Sigma and Kaizen both use Kanban process as cornerstones of process improvement techniques & there are a number of mathematical and statistical studies of the technique which have also delivered some heuristics to follow. So again, old hat.

As a software development professional, I use Kanban all the time and as an agile early adopter, I have done for a good, long while. However, one thing that always crops up, which I believe is fundamentally wrong, is the notion of tickets moving across the board as the work items themselves. I often have to reiterate the ticket isn't the work item, it's a representation of the needs of the work item. A Kanban signal!

Now, in true [just after] 80s style, you can watch some videos explaining the manufacturing equivalent of the pull system:

https://www.youtube.com/watch?v=w3Ud7pEhpQM

Kanban has been used in manufacturing, healthcare, baking etc. and the only one that I admit to taking umbrage at is the software dev Kanban and here's who. Pay particular attention to how this works! A key takeaway is that information flow, the ticket which includes the 'specification' of the batch size/container, flows from right-to-left, whilst the implementation (real thing) flows from left-to-right.

Self-flagellation? 

No, I believe in being realistically critical enough about our own work to find the points for improvement. Admittedly, some folk see this as me being negative and make no mistake, there are times I am especially when trying to get some teams to think about change is like head-butting a wall over and over or swimming through treacle - There are only so many times you can keep head-butting that wall before you cease to add value. So companies without the necessary buy-in can learn the hard way when their competitors overtake them and if some staff then leave or are made redundant, they company and staff find themselves without the requisite skill-set to compete with other candidates on the market. It is a huge problem in the IT world especially and one of the reasons why some people were forced out of the industry as agile methods took over.

We also need to reframe this as learning, not criticism. Especially when considering (For those of us lucky enough to have some understanding of optimisation), a theoretically optimal system isn't guaranteed to be unique in any situation! So you can get more than one optimum so there is more than one right answer at the time. In the case of manufacturing or economic systems, this is because there are often more variables than there are equations to solve them (implicit or explicit). So this naturally becomes an optimisation problem with almost always more than one solution, but those solutions do exist and can be found through iterative methods. 

Whilst I was involved in the creation of the mathematical algorithm and ran that derivative of IPFP for the UN Development Programme's JOrdanian Social Accounting Matrix in 2012 (based on matrix-raking - it's an iterative algorithm) Kanban modelling doesn't need that level of sophistication. For a lot of problems Linear programming is a sufficient way to look at these systems. However, this is outside the scope of this article, as much as it pains me to say it :) So I'll stick with giving you top-3 tips, but assume you're already segmenting customer feature end-to-end (i.e. entire thin Lines of Business).

TOP-3 TIPS


1. Kanban is a Pull-System

CORRECT! It very definitely is a pull system! So why are you pushing cards across a board? Stop doing it! Think about how you can signal that a task is ready to be pulled. Some folk use smaller green stickers/tiny post-it notes etc. 

In my mind, and this isn't shared by everyone (but everyone has been wrong before ;), the ticket represents a container for the item you're producing (whether that is a feature of a system, with many features going into an epic container for the MMF or MVP) or a physical item, such as a container for a 'Login page'. The item is not the login page itself.

The filled container is what the customer wants. If you're Kanban process looks like the following deliberately not perfect example:

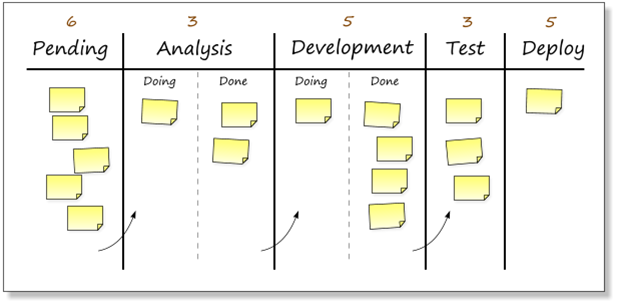
image from bob's lean learning

The arrows represent where the items go when they are pulled form the previous stage, not pushed once done. At the end of the flow, the deployed container is what the customer gets. The customer pulls this from the test stage once it's ready, which pulls this from the development stage once it's ready, which pulls this from the analysis stage once it's ready, which pulls the 'material' from the pending backlog once it's ready. The specifying pull-signal moves from right-to-left. From customer needs, which effectively specify the acceptance criteria for the system through behavioural tests (BDD/Gherkin) or even just BOLT ("As a... I want... so that...") through to picking up the raw materials (tools, projects, repos etc) at the very beginning. You'll note one crucial and perhaps controversial thing... DEVELOPMENT IS NEXT TO LAST!!!!

Before you start shouting off, this doesn't mean that developers are last, inferior or can be demeaned. After all, you're working in multi-function teams and this is a stage not your job or role right? 

Even if you are in charge of it and are feeling insulted or devalued now, ask yourself why that is? Are you protective over your role in the team? Is it Test-Driven Development you are practising? If so, what do you think that truly means? Does the customer care (or is their value measured) by the teasing out or refactoring of tasks which don't pass acceptance tests, glean feedback or deliver much needed value? No, of course not (you better agree!) because the old agile statement about the code being the final arbiter is complete rubbish and has been one that I've thought ridiculous from the start! Whether it delivers value is the true arbiter of the worth of the code and the efficacy of the team. All those feelings of anxiety that may manifest are indicators of 'threat' and dare I say, were felt by the people who were told to move to agile environments some 15 years ago at the turn of the millennium. Indeed, I myself felt them at the time and there is an important lesson in that.

Take a look at this video for 5S a lean manufacturing improvement vendor and see if you can spot some of the things which also conceptually apply to software development (SPOILER ALERT! "All of them") then think about how this can applied in your org:


Or how about this video of a an office space? I think there were more points in this for improvement (HINT: the business cards)


WATCH FOR: No visual indicators of 'ready', usually accompanied by people moving cards into the in-tray of the next stage to the right once complete. This is the same as using 'in-trays' and runs counter to Kanban. QA not being involved (or taken seriously at retrospectives).

TIP: Get small stickers or post-its to show that a task is ready to be pulled, or perhaps have a sub-column for tasks that area ready.

2. Pull-Signals Flow Right-To-Left

Information in the form of pull-signals makes its way from the right hand side of the board to the left hand side of the board. Compare this with a manufacturing plant, where different stages in the process often have differing levels of local inventory, for different parts of the whole. For example 4 screws are used to mount a single kickplate on a door which is pulled as a trolley of doors and kickplates, with the screws at the bench.

In software development a feature is a particular item of meaningful functionality. After going 'backwards' through the testing stage (which remember, is just the container/pull-signal for the work) this may get broken down into smaller architectural chunks, which may have TDD tasks wrapped around them. 

Can you see what I am suggesting here? Yes, QAs are effectively your architects. If you're a developer, then I expect there's PANIC! But again, it is TDD you're practising right?...

The truth of the matter is the market isn't currently aligned to this idea at all. Companies still value testers much less than they do development staff and as a result, most people with development skills do not move into testing roles else they earn around 17% less in salary terms, though the contract market is much better aligned. Until this changes, the motivation for better, more technical test staff will simply not be there.

WATCH FOR: Classic indicators of this are where developers run (and talk most at) the stand-ups, a developers is, say, a Scrum master or team lead, the developers drive change, look at technology choices before customer value, the retrospectives are not data driven or are otherwise poor and the team use only one type of testing process (such as TDD) with no attention to behaviour, increment size, load and/or performance testing. Whilst not exclusively the preserve of developers, it indicates both siloed thinking in job role and no strength being attributed to the test side of the team.

TIP: Encourage buy in from the team and make them aware that the QAs run the testing process. Encourage pairing for KTP and the breaking down of features led by the testers, not the development staff.

3. Business Analysts are also your Feedback!

More often than not, a business analyst is found on a team and they illicit requirements. They also look at the business process at hand and determine the value of the tasks but rarely do I see a business analyst be involved in decisions and reporting ROI and team and capability effectiveness. This is the missing link.

When working lean, the aim is to get feedback on how well the business vertical is working. A business analyst does exactly that! They have to look at the customer value of each and every story and determine the cost-benefit of doing each [thin business vertical] task. They will also help determine the Rate-Of-Return and the Return-On-Investment of a project in the customer's mind as well as look at the customer experience elements, both inside the outside the team. Together with the QA's they are crucial in determining how effective the team are, how well they are working together and determining the scope, location and exposure to any points of waste or constraints in the process. They will be skilled at determining the appropriate contextual metrics and constraints (a bank is different to a mobile social media app start-up) and monitoring the necessary measures of value.

WATCH FOR: Retrospectives without numbers or no change in waste, blockers or bug numbers in each iteration over a period of time or no predictability in flow. This is likely nearly every one you'll ever attend (and is why they're wrong). Some companies, such as Lastminute.com have moved up a level, but they are very very rare!

TIP: Get the business analyst to think about operational expenditure and how the team adds value. If you take the brave (but I think legitimate) step of align reward to profitability, then the business analyst will be crucial in determining that for the team. This will include finding the internal independent variables influencing flow, cycle-time and throughput/velocity, such as number of blockers, bugs, enhancements and other levels of waste.

Summary

Moving to lean from just plain agile is a tough ask for a lot of companies anyway, whichever field they're in. This article gives you necessary but not sufficient things to look for when walking the floor at your company. 

Note, there are better companies out there than us in other fields and we are guilty in the IT world of not being humble enough to understand that. It isn't that the problem of Kanban is any different in software or product development (at least I can't see a significant difference), just that our grasp about what a batch or container is, is very muddy. We can and do use story points, but need to attach these to features which combine into epics and hence make up MVPs and MMFs. Other techniques such as creating thin slices of functionality reduce the variance enough to introduce a reasonable element of predictability into the container or batch size. 

We also think that development is the cornerstone of the business, which any CEO will tell you, isn't true. It's an enabler, often to a product or service which pre-dates computers. If they could get something to do it as fast, but without the development overhead, they'd choose it over developing software any day, as there is much greater uncertainty in software. We already see this inside the IT space with build or buy decisions. So the role of business analyst and QA is crucial in process optimisation and it certainly isn't the preserve of the development team.

Teams inside and outside organisations need to make sure they understand that they are also part of the value chain. Your customer takes a problem, adds value in the solution they create (which includes the software they get you to write) and 'sells it on', providing a solution to their own customers, who may be Joe Public. If you've worked in B2C or B2B service companies before, this is always the case. Being in IT doesn't lose you the economic reasoning and truth be told, in capitalist environments, I think that's unforgivable if you think that's the case. 

Happy Leaning!