A fellow HiveMind expert practitioner, Ian Carroll uses presents systemic flow mapping in his website, which is well worth a read if you're not familiar with the concepts. He also expands on the evolution of this through different stages or 'mindsets', each of which brings benefit and adds to process maturity.
There are many benefits to mapping your process this way. Flow is one thing, as following that chain back to front you can find the bottlenecks in your system. However, as with a lot of agile techniques, a lesser known benefit is that it allows you to understand risk very well. Systemic flow gives these classic techniques of applied mathematics a new lease of life, especially when considering it as part of base-lining business architecture or business process during a transformation programme and using systems thinking approach.
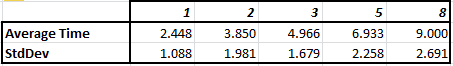
The Problem
Having mapped a systemic flow, or when creating a classic PERT chart in ye olde world, you often find a series of dependent tasks. That in itself is cool and systemic flow mapping doesn't add much that's new in that regard. In PERT, each stage of a chain had a probability of hitting its expected date m (the 50% threshold) and a standard deviation of s. I'll save the details of that for another day, but the important thing to note is there is a level of risk around this and this risk would propagate through a chain.Now substitute the term 'statistical dependence for 'risk' in my previous sentence and read it to yourself. I hope you can see how this more general concept can be applied to any chain of any type and can help you understand trade-offs as well, such as parallel tasks versus risk.
To illustrate this, consider the two chains below. The GO LIVE is specified for a particular date in the future, whether a hard deadline through a compliance or regulatory reporting requirement, competitive advantage in seasonal industries or other such reason.
Sequential Chains
Sequential task processing |
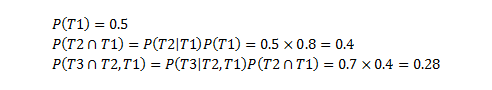
Here there are 3 tasks that need to be completed. The percentages show the probability that a task will complete 'on time' (either in waterfall projects, or indeed, delivering those tasks in a sprint). The tasks are effectively mutually exclusive, given they don't occupy the same probability space, but they do have a dependency, which means that the probability of their success is dependent on the task before. For those conversant with statistics, you'll recognise this as:
This level of uncertainty is normally gleaned from previous performance and 'experience'. For example, manufacturing processes or system design activities. I previously covered how to reduce these risks by chopping up tasks into thin slices, as improves the variance and hence certainty.
So considering the chance of Going live on time, all tasks have to complete on time. So the probability of completing on time is simply the multiple of all the success probabilities, given these conditions:
 |
| Sequential Conditional Probabilties |
So a 28% chance of completing on time!
Shock horror!
Parallel Tasks
"Cha-HAAAA! We'll just run the tasks in parallel!"...
...I hear you cry. OK, maybe not quite like that (stop with the mock Kung-fu already!). The point is, contrary to popular believe, this only improves the probability of success if running those tasks in parallel then gives each task a greater chance of completing before the GO LIVE date! After all, they all still have to complete:
 |
| parallel version of the same tasks |

I have come across parallel tasks like this several times, where say, Task 1 is the hardware platform, Task 2 is the code and Task 3 is a data migration. This is risky!
The Solution
As per vertical slicing, the key is to segment the tasks so that each can be deployed as a separate piece of work, able to deliver value to the organisation even if the rest of the project doesn't make it, is canned, or is late. It's about breaking the dependencies all the way along the chain, so that the statistical fluctuations of ToC are removed (so if the statistical fluctuations do happen, and they will, who cares?) for those of you familiar with theory of constraints or queuing theory. Looking at how this would works: |
Three separate deployments to live |
This time, tasks 1, 2 and 3 all deploy functional projects into production with the same risks as before. Looking at the individual risks, they are 50%, 80% and 70% respectively. Given the overall success rate of both the previous methods was 28%, this is a significant improvement, without even considering the real life benefits of greater certainty.
You can apply this thinking to much more complex streams of work. I'll leave the following exercise for you readers out there. Take note that the conditional probability 'carried over' to the next task has obviously got to be the same for each successive task. For example, Task 1 has a 60% chance of coming in on time and hence Tasks 2 and 3 both have the same probability coming in. I know how keen you are to give this a go ;)
 |
| Give this a go! |
Conclusion
As you can see, where an organisation hasn't made it to the "Mature Synergistic Mindset" that Ian Carroll introduces in his blog (i.e. vertical slices) the structuring of projects and programmes can rely very heavily on this sort of process to find where stuff goes. Risk is only one aspect to this. You can use the same technique, where the arrows map waste time (i.e. time spent in inventory) and then use say, IPFP or linear programming with appropriate constraints to find an optimum point.However, be careful that this is an in-between technique, not the goal. The goal isn't to have the analysis, it is to make your process more efficient by reducing dependency, and the impact of statistical fluctuation on your project.